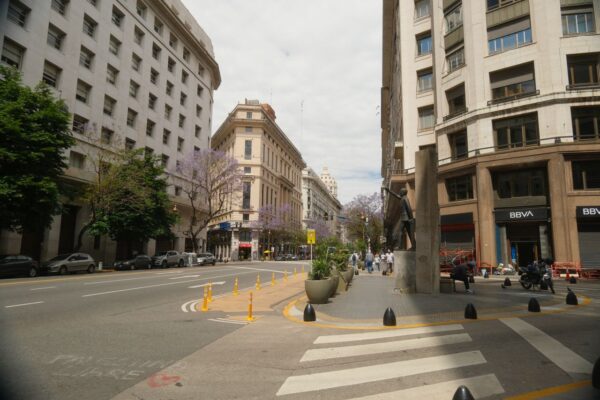
Buenos Aires closed the second quarter of 2026 with Class-A office vacancy at 15.9%, according to Newmark Argentina. Read alone, that suggests an oversupplied market where tenants hold the leverage.
Two things complicate it. The first is the one usually noted: the citywide average blends corridors running at 5% vacancy with corridors running at 25%. The second is rarely noted at all: 15.9% is one of four figures for the same market in the same quarter, and the four major consultancies disagree not only on the level but, in the case of the second quarter, on the direction of travel.
Anyone using a single number to negotiate a lease or underwrite an asset should know which number they are holding.
The same quarter, four readings
| Consultancy | Q2 2026 vacancy | Q2 net absorption | Asking rent |
|---|---|---|---|
| Newmark | 15.9% | +3,968 sqm (gross 23,464) | USD 23.71 (Q1 figure) |
| Colliers | 13.97% | +11,434 sqm | USD 22.42 (A+ 23.27 / A 20.43) |
| CBRE | 14.9% (Q1); falling | +25,660 sqm | USD 22.60 (Q1) |
| Cushman & Wakefield | — | +14,584 sqm | — |
The vacancy spread is nearly two percentage points. That alone is wider than the quarterly movement any of them reports.
The absorption divergence is stranger still. Newmark records net absorption falling from 36,141 sqm in Q1 to 3,968 sqm in Q2. Cushman & Wakefield records almost the mirror image: 3,999 sqm in Q1 rising to 14,584 sqm in Q2, a 264.7% increase, and describes the quarter as a marked acceleration. CBRE has Q2 at 25,660 sqm against 19,405 sqm in Q1, with a cumulative 45,065 sqm for the year. Colliers has Q2 positive at 11,434 sqm.
Three of four say demand accelerated. One says it nearly stopped. The difference is methodological — what counts as Class A, whether Greater Buenos Aires corridors are included, how relocations within the same building are treated — but the practical consequence is that “the market improved in Q2” and “the market stalled in Q2” are both defensible from published data.
The honest reading: the weight of evidence favours acceleration, but a report built on Newmark’s series alone will say the opposite, and both appear in the press without qualification.
The trend, which is not in dispute
Whatever the quarterly noise, the multi-year direction is consistent across sources. Class-A vacancy closed 2024 at 18.8%. Newmark’s series then runs 17.9% in Q1 2025, 16.7% in Q4 2025, 15.6% in Q1 2026, 15.9% in Q2. CBRE has 14.9% in Q1 2026 against 16.5% a year earlier, having broken below 15% for the first time in the cycle. Colliers has 14.5% in Q1 falling to 13.97% in Q2.
Vacancy has fallen roughly three points in eighteen months. The 15.9% headline is not a market deteriorating; it is a market recovering from a much worse position.
The corridors, with actual numbers
The submarket figures are published and specific. CBRE’s Q1 2026 breakdown:
| Corridor | Vacancy |
|---|---|
| Polo Saavedra | 5.3% |
| Puerto Madero | 8.2% |
| Corredor Libertador GBA | 9.8% |
| Citywide average | 14.9% |
| Corredor Panamericana | 23.9% |
| Microcentro | 25.0% |
The spread between Saavedra and Microcentro is nearly twenty points inside one city. That is the dispersion the average conceals.
A note on sources: these submarket figures are CBRE’s; the 15.9% headline is Newmark’s. Polo Saavedra is not a submarket in Newmark’s classification, which uses Zona Norte CABA (Polo DOT, Corredor Libertador CABA), Zona Norte GBA (Panamericana, GBA Libertador), CBD (Catalinas-Retiro, Puerto Madero, Microcentro, 9 de Julio), Zona Sur, and emerging poles including Palermo and Parque Patricios. Mixing an aggregate from one house with submarkets from another is common in coverage and worth flagging when it happens.
Where demand actually went
The corridors absorbing space are not always the ones with the lowest vacancy, and this is where the article-level analysis usually stops short.
In Q2 2026, Cushman & Wakefield recorded the periphery outpacing the centre: Non-CBD took 10,716 sqm against 3,866 sqm in the CBD. Within that, Corredor Libertador CABA led the entire market with 7,751 sqm of net absorption, followed by the Distrito Tecnológico with 2,695 sqm. Libertador’s vacancy fell 4.9 percentage points in the quarter; Retiro–Plaza San Martín fell 2.4 points.
In Q1, the pattern was different again: Newmark had the CBD at 23,747 sqm and Zona Norte CABA at 16,588 sqm, while CBRE identified Zona Norte CABA as the quarter’s main driver at 13,919 sqm net, driven by transactions in Palermo. Colliers reported demand concentrating in Catalinas, Norte CABA and Puerto Madero.
Two corridors that barely appear in most coverage — Libertador CABA and the Distrito Tecnológico — accounted for the bulk of Q2 movement. Palermo and Parque Patricios are the emerging poles to watch.
Puerto Madero and Saavedra: why they are tight
Puerto Madero at 8.2% remains the city’s most prestigious address, combining proximity to the financial district, recent-generation towers and an amenity offer that weighs in regional-headquarters decisions. Its constraint is contiguous large floorplates: single-floor spaces above 1,000 sqm are scarce, which pushes larger tenants toward other premium corridors simply because the footprint does not exist. That scarcity is part of why the corridor sustains the city’s highest asking rents — with limited large-floorplate supply, landlords have little incentive to negotiate.
Polo Saavedra at 5.3% is the tightest submarket in the city. It has built a corporate profile deliberately distinct from Catalinas or Madero: mid-sized floorplates, materially lower rents, and connectivity toward the northern suburbs. That made it attractive to technology firms, shared-service centres and customer-support operations needing headcount volume without a premium address. For a tenant measuring total occupancy cost — rent plus staff commuting plus technical specification — it currently offers one of the better trade-offs available.
Corredor Libertador GBA at 9.8% sits at the boundary between the consolidated premium corridors and the rest of the market. It offers Class-A specification without CABA rents, and proximity to the higher-income northern residential areas that supply much of the managerial workforce. Its vacancy is low relative to the average but meaningfully above Saavedra or Madero, which suggests the compression process here is at an earlier stage.
Rents: a narrower spread than the narrative implies
Asking rents cluster more tightly than the vacancy dispersion would suggest.
Newmark reported USD 23.71/sqm/month in Q1 2026, stable. Colliers has USD 22.42 in Q2, with A+ at 23.27 and A at 20.43 — a gap of under three dollars between the top tier and the one below it. CBRE had USD 22.60 in Q1. One brokerage reading puts Class A at USD 26.1 against Class B at USD 20.7.
Two observations follow. First, the headline USD 23.71 figure is Newmark’s Q1 number; it should not be quoted as a first-half average, since the Q2 office rent is not consistently reported across sources. Second, a market with twenty points of vacancy dispersion and under three dollars of rent dispersion between A+ and A is one where price has not yet adjusted to availability. That gap is the tenant’s opportunity and the landlord’s exposure.
The supply story is the opposite of oversupply
This is where most analysis of the Buenos Aires market goes wrong, and the error runs in a specific direction.
No new buildings entered the market in Q2 2026. Colliers, Cushman & Wakefield and CBRE all confirm it. Inventory held stable at roughly 2.3 million sqm of Class A and A+. Colliers noted that the absence of new supply allowed recovering demand to translate directly into falling availability — something that had not happened for several years.
The pipeline is thin and its entry is gradual:
| Source | Under construction | In project stage |
|---|---|---|
| Cushman & Wakefield (Q2 2026) | 112,399 sqm | 46,558 sqm |
| Colliers (Q1 2026) | 59,644 sqm, mainly Norte GBA and Norte CABA | — |
| Market reporting (Q1 2026) | ~166,107 sqm, entering gradually over three years | — |
CBRE’s forward view is explicit: low construction activity continues to limit available supply and favour absorption of existing stock, and while new developments are in planning, their arrival will take years — so vacancy is expected to keep falling, particularly in the most demanded corridors.
The market’s own diagnosis, articulated since 2025, is a renovation shortage rather than a glut: the absence of new AAA projects, attributed to economic uncertainty, financing constraints and weak absorption during the pandemic years, has left the premium segment facing a quality-renewal problem.
One caution on a figure in circulation. A pipeline of 180,900 sqm concentrated in Zona Oeste is sometimes cited in office-market coverage. That figure comes from Newmark’s Q2 2026 industrial and logistics section, not its office data — the same paragraph reports logistics vacancy of 6.6% and asking rent of USD 7.5/sqm. Zona Oeste is a logistics corridor. Office asking rents in Buenos Aires run at USD 20–26. The two should not be combined.
Reconversion: the market’s answer
With almost nothing being built and premium availability tightening, the response emerging is conversion of existing buildings in strategic locations rather than new construction. Practitioners in the space argue that adding technology, services and professional management will increasingly determine whether an existing asset stays competitive.
That is the forward-looking question for this market: not whether new square metres will flood the corridors, but whether enough existing stock can be upgraded fast enough to meet demand that is now returning.
What it means
For a tenant negotiating in 2026, leverage depends entirely on which building is on the table. At 5.3% in Saavedra or 8.2% in Puerto Madero there is very little room; at 25% in Microcentro or 23.9% on Panamericana there is a great deal. The citywide average that circulates in the press is not a negotiating position. And with rent dispersion far narrower than vacancy dispersion, a well-specified building in a higher-availability corridor is currently the clearest value in the market.
For an owner of older stock, the pressure is not from new competition — there is almost none arriving — but from obsolescence relative to reconverted buildings in the same corridor. The relevant capital decision is upgrade versus hold.
For an investor, two things matter more than the headline. Which consultancy’s series is being underwritten, given a two-point vacancy spread and disagreement on the direction of quarterly absorption. And the fact that the constraint in this market is supply of quality space, not demand for it — which argues for reconversion opportunities over ground-up development on current fundamentals.
Verification checklist
| Figure | Source | Note |
|---|---|---|
| Vacancy 15.9% | Newmark, Q2 2026 | Colliers 13.97%, CBRE 14.9% (Q1) — nearly two points apart |
| Q2 net absorption | Four sources | Newmark shows a fall; C&W, CBRE and Colliers show a rise |
| Submarket vacancy | CBRE, Q1 2026 | Not Newmark’s classification; Polo Saavedra is CBRE’s submarket |
| Asking rent USD 23.71 | Newmark, Q1 2026 | Q1 figure; not a first-half average |
| Pipeline | C&W 112,399 + 46,558 sqm; Colliers 59,644 sqm | Gradual entry over roughly three years |
| 180,900 sqm Zona Oeste | Newmark, Q2 2026 | Industrial and logistics, not office |
| Inventory | ~2.3m sqm A and A+ | Stable; no new buildings entered in Q2 2026 |
Sources
Newmark Argentina — Class-A office market reports, Q1 and Q2 2026, and industrial market report Q2 2026; CBRE — Buenos Aires office reports, Q1 and Q2 2026; Colliers Argentina — office market reports Q1 and Q2 2026, with commentary from commercial manager Juan Manuel Farola; Cushman & Wakefield — Market Beat Oficinas Clase A, Q2 2026; Branson Real Estate commentary from Marisa Koifman; Waves commentary from Marcos Villanueva; reporting by Ámbito, iProfesional, MDZ, Revista Mercado, Bank Magazine and La Nación.
Figures reflect consultancy reporting on the first half of 2026 and were current at the time of writing. The four consultancies cited use different market definitions, submarket boundaries and inventory bases; their figures are not interchangeable and should not be averaged. General information on commercial property markets. Not investment, tax or legal advice.